Friday, June 29, 2007

OFHEO’s Absurd Sleight of Hand

This week the Office of Federal Housing Enterprise Oversight (OFHEO) published a request for public comment regarding its proposed policy changes to the procedures used to determine the conforming loan limit for 2008 and beyond.

The conforming loan limit is the maximum loan size that the Government Sponsored Enterprises (GSE), namely Fannie Mae and Freddie Mac, can purchase and today stands at $417,000.

The importance of this value should not be overlooked as it is the key determining factor that distinguishes GSE purchased loans, which generally come with a lower interest rate due to a presumed (yet not necessarily factual) government guarantee, from “Jumbo” loans which are available unfettered from private lending institutions.

In fact, OFHEO considers loans purchased by a GSE in excess of its conforming loan limit to be “unsafe and unsound practice, running contrary to statute”.

That said, the proposed changes relate to the method of determining the limit in the face of declining home prices.

First, it’s important to note that the method for determining the limit when prices are climbing is relatively simple.

The Federal Housing Finance Board (FHFB) confidentially delivers the results of their October Monthly Interest Rate Survey (MIRS) to OFHEO which intern applies a calculation to the average home price to determine the new maximum lending limit.

OFHEO then announces publicly the new limit for loans made during the following year.

Simple enough… October average home price + some calculation = new maximum limit.

So what is the issue you say?

It seems that OFHEO is struggling with the idea of applying that same simple methodology when prices are on the decline.

Reading the proposed procedures, it’s clear that the government has a bias toward inflating home values and is doing just about everything it can to maintain the current limit under the guise of not negatively impacting the market.

This is really an outrageous matter when one considers that the ever increasing limit, that was even a surprise to mortgage brokers and lenders during the boom years, had without a doubt contributed to fueling the housing mania.

With the proposed changes, a downward revision to the limit, even in the face of falling home prices, may be deferred for as long as 2-3 years or more.

I would strongly urge that you let OFHEO know what you think of their proposed changes as well as making your own recommendations by emailing OFHEO at the following email address ofheoguidancecomments@ofheo.gov.

Below are the proposed procedures for setting the limit when home values are declining:
  1. In a year in which the October house price level is lower than the level of the previous October, OFHEO will defer the impact of that decline on the conforming loan limit for one full year. The effect of the price level decline of 0.16% from October 2005 to October 2006 was deferred in this manner.

  2. After deferring the impact of a decline in the average price level for one year

    (A) if the price level falls in the following year, the latter decline will be deferred one year, and the maximum loan limit will be adjusted by the decline of the former year. However, the decrease will be deferred to the next year unless it exceeds one percent (1%); or
    (B) if the price level increases the following year, then the prior year’s (or years’) decline(s) will be subtracted from such increase, unless such subtraction(s) result(s) in a decrease of less than 1%, in which case such decrease will be carried forward to the next year.

  3. All loans that were within the conforming loan limit at the time of origination will continue to be deemed within the conforming loan limit during the remaining lives of such loans, regardless of whether the loan limit for any subsequent year declines to a level below the limit at the time of origination.
And here is an example of the actual implementation of these procedures:

In November 2007,

(a) if the average house purchase price has gone up during the year, for example by 2 percent, the deferred decline of 0.16 percent would be subtracted, and the new loan limit beginning January 2008 would show an increase of 1.84 percent.

(b) if the average house purchase price has gone up during the year, for example by 0.10 percent, then the deferred decline would offset that 0.10 percent increase and a 0.06 decline would be carried forward. The conforming loan limit would remain the same at $417,000.

(c) if the average house purchase price has gone down, the conforming loan limit will remain at $417,000 for 2008.

The deferred decline will be added to the 0.16 percent and carried forward until the next calculation in November 2008, as follows:

(i) if the average house purchase price goes up during 2008, the conforming loan limit will be calculated per (a) or (b) above with the offset being the cumulative deferred decline of 0.16% and the November 2007 decline;

(ii) if the average house purchase price goes down during 2008 and the cumulative deferred decline of 0.16 percent from 2006 and the decline from 2007 coupled with the 2008 decline still total less than 1 percent, the conforming loan limit would remain at $417,000 in 2009; or,

(iii) if the average house purchase price goes down during 2008 and the cumulative deferred decline of 0.16 percent from 2006 and the decline from 2007 and 2008 totals 1.0 percent or greater, then the conforming loan limit for 2009 will be adjusted downward by that cumulative deferred decline.

Thursday, June 28, 2007

GDP Report: Q1 2007 Final

Today, the Bureau of Economic Analysis (BEA) released their third and final installment of the Q1 2007 GDP report showing truly anemic growth of 0.7% weighed down by, amongst other things, continued weakening to fixed residential investment.

As with last months preliminary report, major praise has to go to Professor Nouriel Roubini for his accurate forecasting having called this deceleration to GDP well in advance, virtually nailing the actual figure as well.

Residential fixed investment, that is, all investment made to construct or improve new and existing residential structures including multi–family units, continued its historic fall-off registering a decline of 15.8% since last quarter while shaving .89% from overall GDP.

Housing continues to be, by far, the most substantial drag on GDP subtracting an amount far surpassing the contributions made by ALL non-durable goods including food, clothing, gasoline, fuel oil.

The following chart shows real residential and non-residential fixed investment versus overall GDP since Q1 2003 (click for larger version).

Wednesday, June 27, 2007

Reading Rates: MBA Application Survey - June 27 2007

The Mortgage Bankers Association (MBA) publishes a weekly applications survey that covers roughly 50 percent of all residential mortgage originations and tracks the average interest rate for 30 year and 15 year fixed rate mortgages as well as application volume for both purchase and refinance applications.

The purchase application index has been highlighted as a particularly important data series as it very broadly captures the demand side of residential real estate for both new and existing home purchases.

The latest data is showing that the average rate for a 30 year fixed rate mortgage went unchanged since last week remaining near the peak for the year at 6.60% while the purchase volume decreased 4.9% and the refinance volume decreased 2.5% compared to last weeks results.

It’s important to note that the data is reported (and charted) weekly and that the rate data represents average interest rates, and the index data represents mortgage loan application volume for home purchases, home refinances and a composite of all loans.

The following chart shows how the principle and interest cost and estimated annual income required to cover the PITI (using the 29% “rule of thumb”) on a $400,000 loan has changed since January 2007.


The following chart shows the average interest rate for 30 year and 15 year fixed rate mortgages over the last number of weeks (click for larger version).

The following charts show the Purchase Index, Refinance Index and Market Composite Index since January 2007 (click for larger versions).


Tuesday, June 26, 2007

Crashachusetts Existing Home Sales: May 2007

Today, the Massachusetts Association of Realtors (MAR) released their Existing Home Sales Report for May 2007 showing further weakness to the regions residential housing market with sales of single family homes declining 7.5% compared to May of 2006.

Along with the release, MAR President Doug Azarian continued to maintain an optimistic outlook even in the face of renewed sales declines and the obvious implications of tighter lending standards.

“While tighter lending standards and reduced mortgage options for some prospective buyers this year may have had an impact on the market, stable prices and declining supply indicate there is still a steady demand. In fact, May is the fifth straight month that residential supply levels have gone down. We can speculate that demand will continue to go up during the second half of the year.”

Note that a key tenet of Azarian’s optimistic outlook depends on the “stable” prices seen when calculating the median prices based on the MAR MLS data.

Using the broader data reported during deed and mortgage transactions filed in the state's registries of deed, The Warren Group showed a 4.6% year-over-year decline to the median price of a single family home.

It’s important to note, also, that the Warren Groups numbers are more consistent with the trend and latest year-over-year results seen in the S&P/Case-Shiller index for Boston which today showed a 4.52% decline to single family home prices with futures indicating further declines for the remainder of the year and on into 2008.

Additionally, although the “MLS listed” inventory has declined throughout the last year, the sales pace has dramatically slowed resulting in an average of a 139 “days on market” for a single family home, an increase of nearly 15% compared to May 2006.

With significantly falling prices, continued declining sales volume and a slowing pace of sales, it seems hard to believe that Azarian’s optimistic outlook has any merit especially when considering that all of this weakness is coming on the back of the historic declines seen in 2006.

A more likely scenario is that our area is experiencing a fundamental correction to prices that, through unusually low interest rates and historically easy lending standards, were able to rocket to irrational heights during the run-up years.

To better illustrate the drop-off in home prices and the potential length and depth of the current housing decline, I have compared BOTH the year-over-year and peak percentage changes to the S&P/Case-Shiller home price index for Boston (BOXR) from the 80s-90s housing bust to today’s bust (ultra-hat tip to the great Massachusetts Housing Blog blogger for the concept).


The “year-over-year” chart compares the percentage change, on a year-over-year basis, to the BOXR from the last positive value through the decline to the first positive value at the end of the decline.

In this way, this chart captures only the months that showed monthly “annual declines” and as we can see, if history is to be a guide, we could be about one third of the way through the annual price declines with the majority of falling prices yet to come.

The “peak” chart compares the percentage change from the peak, comparing monthly BOXR values to the peak value seen just prior to the first declining month all the way through the downturn and the full recovery of home prices.

In this way, this chart captures ALL months of the downturn from the peak to trough to peak again.

As you can see the last downturn lasted 105 months (almost 9 years) peak to peak including 34 months of annual price declines during the heart of the downturn.

Notice that peak declines have been more significant to date and, keeping in mind that our current run-up was many times more magnificent than the 80s-90s run-up, it is not inconceivable that current decline will run deeper and last longer.

As in months past, be on the lookout for the inflation adjusted charts produced by BostonBubble.com for an even more accurate "real" view of the current market trend.

May’s Key Statistics:

  • Single family sales declined 7.5% as compared to May 2006
  • Single family median price increased 0.7% as compared to May 2006
  • Condo sales increased 0.2% as compared to May 2006
  • Condo median price increased 1.4% as compared to May 2006
  • The number of months supply of single family homes stands at 9.5 months.
  • The number of months supply of condos stands at 7.8 months.
  • The average “days on market” for single family homes stands at 139 days.
  • The average “days on market” for condos stands at 134 days.

New Home Sales: May 2007

Today, the U.S. Census Department released its monthly New Residential Home Sales Report for May showing renewed declines and a 5.10% downward revision to last month’s unexpected “surge”.

As with prior months, on a year-over-year basis sales are still declining in the double digits at 15.8% below the sales activity seen in May 2006.

It’s important to keep in mind that these declines are coming on the back of the significant declines seen in 2006 further indicating that the decline is not abating.

This should not be understated as it is clearly showing continued and even accelerating weakness to new home sales.

The following charts show the extent of sales declines seen since 2006 as well as illustrating the further declines 2007 is showing on top of the 2006 results (click for larger versions)

Note that the last chart essentially combines the year-over-year changes seen in 2005 and 2006 and shows sales trending down precipitously as compared to the peak period.


Look at the following summary of today’s report:

National

  • The median price for a new home was down .88% as compared to May 2006.
  • New home sales were down 15.8% as compared to May 2006.
  • The inventory of new homes for sale declined 5.0% as compared to May 2006.
  • The number of months’ supply of the new homes has increased 14.5% as compared to May 2006.
Regional

  • In the Northeast, new home sales were up 19.1% as compared to May 2006.
  • In the West, new home sales were down 21.1% as compared to May 2006.
  • In the South, new home sales were down 17.9% as compared to May 2006.
  • In the Midwest, new home sales were down 21.1% as compared to May 2006.

S&P/Case-Shiller: April 2007

Today’s release of the S&P/Case-Shiller home price indices for April continued to show weakness for the nation’s housing markets with 14 of the 20 metro areas tracked reporting significant declines.

Topping the list of decliners on a year-over-year basis was Detroit at -9.35%, San Diego at -6.70%, Washington DC at -5.70%, Tampa at -4.97 and Boston at -4.52%.

Additionally, both of the broad composite indices showed accelerated declines slumping -2.69% for the 10 city national index and -2.13% for the 20 city national index resulting in the first negative appreciation on an annual basis since the 1990-1991.

To better visualize the results use the PaperMoney S&P/Case-Shiller/Futures Charting Tool and be sure to read the Tutorial in order to best understand how best to utilize the tool.

Additionally, in order to add some historical context to the perspective, I updated my “then and now” CSI charts that compare our current circumstances to the data seen during 90s housing decline using BOTH annual and "peak" percentages changes.

To create the following annual charts I simply aligned the CSI data from the last month of positive year-over-year gains for both the current decline and the 90s housing bust and plotted the data with side-by-side columns (click for larger version).

What’s most interesting about this particular comparison is that it highlights how young the current housing decline is, having only posted four consecutive year-over-year (YOY) monthly declines to home prices.

Looking at the actual index values normalized and compared from the respective peaks, you can see that we are only ten months into a decline that, last cycle, lasted for roughly fifty four months during the last cycle (click the following chart for larger version).


The “peak” chart compares the percentage change, comparing monthly CSI values to the peak value seen just prior to the first declining month all the way through the downturn and the full recovery of home prices.

In this way, this chart captures ALL months of the downturn from the peak to trough to peak again.

As you can see the last downturn lasted 97 months (over 8 years) peak to peak including roughly 43 months of annual price declines during the heart of the downturn.

Notice that peak declines have been FAR more significant to date and, keeping in mind that our current run-up was many times more magnificent than the 80s-90s run-up, it is not inconceivable that current decline will run deeper and last longer.

Monday, June 25, 2007

Existing Home Sales Report: May 2007


Today, the National Association of Realtors (NAR) released their Existing Home Sales Report for May showing worsening and uniform weakness to the nations housing markets.

Senior Economist Lawrence Yun is now suggesting that the decline is mostly as a result of the psychology of buyers but interestingly, and somewhat atypically, offers a more fundamental reason for the lack of demand, namely dramatically decreased household formation.

“I think psychological factors are currently the biggest drag on the housing market, in addition to a disruption from tighter credit for subprime borrowers, … Household formation has slowed dramatically since late 2006, implying that many people are doubling-up – they’re adding roommates or moving in with parents.

“The market is underperforming when you consider positive fundamentals such as the strength in job creation, economic growth, favorable mortgage interest rates and flat home prices. It appears some buyers are simply waiting for more signs of stability before they get serious about getting into the market.”

Additionally, NAR President Pat Vredevoogd Combs continues to attempt to scare buyers into action with the threat of increased interest rates.

“Although mortgage interest rates are trending up, they are historically favorable, … Buyers who’ve been on the sidelines may want to take a closer look at current conditions in their area – if they wait for sales to rise, their choices and negotiating position won’t be as good as they are now.”

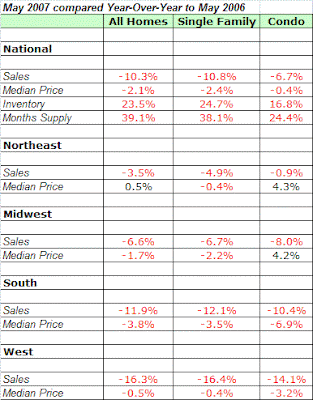
Looking at May’s Existing Home Sales report should only result in additional confirmation that the nation’s housing markets are continuing to experience weakness with virtually all regions showing considerable declines to median price AND sales as well as significant increases to inventory and monthly supply.

Sales are, in fact, down in EVERY region with the majority of declines in the double digits.

Keep in mind that we are now seeing existing home sales declines on the back of last years fairly dramatic declines further indicating that the housing markets are not bottoming as many had been suggested last fall.

Below is a chart consolidating all the year-over-year changes reported by NAR in their May 2007 report.

Particularly notable are the following:

  • Overwhelming majority of median prices are now down.
  • ALL sales are down with most in the double digits.
  • ALL Inventory and Months Supply show HIGH double digit increases on a year-over-year basis.

Thursday, June 21, 2007

Hovnanian on Housing

Recently, a host of homebuilders attended the Bank of America 2007 Homebuilders Conference where they made presentations and discussed at length their current state of homebuilding and their outlook for future.

Particularly interesting was the presentation and following Q&A by Ara Hovnanian, CEO of Hovnanian Enterprises (NYSE:HOV), who has been, in general, very straightforward about the nature of the decline and its impact on his business.

The following are some excerpts from his segment.

When asked about the signs he would be look to to indicate a turning point in the decline Hovnanian responded:

“Well clearly, one of the things we are much more focused on then we ever were before is MLS listings in a given market. That is a dynamic that’s changed, we’re tracking it in every market. At the moment, unfortunately, most markets are showing negative signs in terms of the increasing MLS listings and lower monthly sales every month. ”

Asked about the nature of “spec” homes in the industry:

“Well, certainly there are several home builders out there essentially are building specs as a means of liquidating land. In the beginning, I was more concerned because they were building new specs at a rate which was far greater than their sales. However, what we’ve seen now is those that were in that mode are basically building specs to equal their sales. So, if they sell 20 specs, they start 20 more spec, if they sell those 20 they start 20 more. I think what is going to be an important bellwether to look at and is not something that there is easy data to collect, that is the number of improved lots. I think what most of the major homebuilders are interested in doing is liquefying their capital intensive positions and that’s in developed land.”

When asked about projecting future earnings:

“At the forty thousand foot level, I think what I can say is we’re not banking on generating our big cash flows from huge earnings right now. We can’t control that at the moment the market is what it is and frankly as we said earlier, we can barely project out six months let alone all of 08.”

When asked about the quality of their current land holdings:

“Well first of all, at the moment almost any land is too much land because many times the real value to replace it today, if there was trading and there is hardly and trading, but you’ve got to think that you should be able to replace it at some point in the future cheaper. In general, yea there are places where I wish we had less land. Florida for sure, definitely parts of California for sure, but even those markets we’ve got properties that are undervalued and I wish we had more lots in them.”

“We are, in interesting cases, we walked away from a couple of parcels of land that were under option… the land sellers have come back to us, offered us property at realistic valuations after they tried to shop it to other home builders, couldn’t find anyone else willing to pay unrealistic prices and we have re-entered new contracts at substantially lower prices.”

“But the number of opportunities are far far less than our burn rate right now.”

When asked about price reductions in their southern California markets:

“We are, in Riverside County and San Bernardino County definitely having to adjust prices recently, as recent as the last month in that marketplace to keep pace and it is very competitive. As one competitor lowers prices and sucks away all the sales, the other builders then have to react basically it’s becoming little bit of a ratcheting effect. We saw the exact same thing in San Diego.”

Speaking generally on assessing the outlook for the future, Hovnanian suggested:

“The interesting thing about this particular slowdown, and I guess I don’t want to be painted as an optimist because we’re acting quite conservative today. But there is some interesting spread of light out there that’s worth mentioning. The last two major slowdowns we had to deal with, 81 and 91, were very different economic environments. We had a national recession going on in both of those periods that was full on, numerous quarters. We had job losses. Today we pick up the paper and read bad news about homebuilding, back then we were reading about layoffs at every major company imaginable every single day. That was a very challenging environment and if that wasn’t enough we had very high interest rates particularly in 81 but relatively speaking in 91 we had very high rates.

Today, it’s a very interesting time because demographically demand is better. Every actuarialist and demographic scientist is predicting higher household growth. Secondly, the economy is good, a little slower than it was in 05, but still positive 1-2% is the outlook which is not terrible, not job loss but job gains. And three, interest rates are pretty good.

So it’s a more optimistic environment, I think, to turn the corner at some point.

If we could just get through some of this inventory overhang and most importantly, if we can get through the psychological effects that’s really taken over the consumer today.“

Listen to the complete presentation here as well as the presentations by Toll Brothers executives and DR Horton as well.

Wednesday, June 20, 2007

Reading Rates: MBA Application Survey - June 20 2007

The Mortgage Bankers Association (MBA) publishes a weekly applications survey that covers roughly 50 percent of all residential mortgage originations and tracks the average interest rate for 30 year and 15 year fixed rate mortgages as well as application volume for both purchase and refinance applications.

The purchase application index has been highlighted as a particularly important data series as it very broadly captures the demand side of residential real estate for both new and existing home purchases.

The latest data is showing that the average rate for a 30 year fixed rate mortgage has decreased slightly to 6.60% while the purchase volume decreased 3.0% and the refinance volume decreased 4.2% compared to last weeks results.

It’s important to note that the data is reported (and charted) weekly and that the rate data represents average interest rates, and the index data represents mortgage loan application volume for home purchases, home refinances and a composite of all loans.

The following chart shows how the principle and interest cost and estimated annual income required to cover the PITI (using the 29% “rule of thumb”) on a $400,000 loan has changed since January 2007.

The following chart shows the average interest rate for 30 year and 15 year fixed rate mortgages over the last number of weeks (click for larger version).

The following charts show the Purchase Index, Refinance Index and Market Composite Index since January 2007 (click for larger versions).


Tuesday, June 19, 2007

Homebuilder Blues: NAHB/Wells Fargo Home Builder Ratings June 2007

Yesterday, the National Association of Home Builders (NAHB) released their Housing Market Index (HMI) showing additional evidence that the new home market is experiencing a new leg down in declines.

Measuring builder confidence across six key data points, the builder survey has been a bellwether for the new home market since 1985.

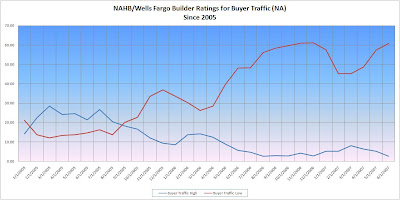
The component measures used to formulate the overall HMI are respondent ratings on “present conditions”, “future conditions” and “buyer traffic” all of which continue to indicating significant current and future weakness as the new home market slumps its way slowly forward, now long separated from an exceptionally disappointing spring selling season.

The following charts show “present conditions”, “future conditions” and “buyer traffic” both smoothed since 1986 and unadjusted since 2005 (click for larger versions).

Keep in mind that for each measure respondents are asked to assign both a “good” and “poor” rating so in each chart you will notice “good” slumping while “poor” is surging.


New Residential Construction Report: May 2007

Today’s New Residential Construction Report continues to indicate significant weakness in the nations housing markets and for residential construction showing large declines on a year-over-year basis to single family permits, starts, and completions nationally and across every region.

Single family housing permits, the reports most leading of indicators, again suggests substantial weakness in future construction activity dropping 27.7% as compared to May 2006.

Keep in mind that these declines are coming on the back of last year’s record declines.

To illustrate the extent to which permits and starts have declined, I have created the following charts (click for larger versions) that show the percentage changes of the current values compared to the peak years of 2004 and 2005.

Notice that on each chart the line is essentially combining the year-over-year changes seen in 2005 and 2006 and shows virtually every measure trending down precipitously.

Although year-over-year declines to permits, for example, have not accelerated measurably from September 2006, the fact that they continue to decline roughly 30% should provide a solid indication that they are by no means stabilizing.


Remember that permits, starts, and competitions are not simply independent measures but are, in fact, three logically related and dependent measures.

In the process of a building project, first you get the “permit”, next you “start” building, and finally you “complete” the project.

For this reason, one must adjust expectations prior to reading a newly released Census Department report to account for the true nature of the data published simultaneously each month.

As in past months, I have “smoothed” out the unadjusted data and aligned the three data series (i.e. moved starts back a month and completions back six months) to make more obvious their trend.

The following is the unadjusted permits, permit-starts and permit-completion data charted since 2000 (click for larger version).

The following is the unadjusted permits, permit-starts and permit-completion data smoothed with a 12 month moving average (click for larger version).

The following is the smoothed data aligned to indicate the dependent nature of each series and showing the obvious leading nature of permits (click for larger version).

The following is the aligned data normalized to make the relationship even more obvious (click for larger version).

Here are the statistics outlined in today’s report:

Housing Permits

Nationally

  • Single family housing permits down 1.8% from April, down 27.7% as compared to May 2006
Regionally

  • For the Northeast, single family housing down 7.6% from April, down 15.0% as compared to May 2006.
  • For the West, single family housing permits down 2.6% from April, down 28.8% as compared to May 2006.
  • For the Midwest, single family housing permits up 5.4% from April, down 21.8% as compared to May 2006.
  • For the South, single family housing permits down 2.6% from April, down 30.5% compared to May 2006.
Housing Starts

Nationally

  • Single family housing starts down 3.4% from April, down 26.0% as compared to May 2006.
Regionally

  • For the Northeast, single family housing starts up 0.9% from April, down 20.6% as compared to May 2006.
  • For the West, single family housing starts down 12.1% from April, down 33.3% as compared to May 2006.
  • For the Midwest, single family housing starts up 9.1% from April, down 23.2% as compared to May 2006.
  • For the South, single family housing starts down 3.4% from April, down 24.2% as compared to May 2006.
Housing Completions

Nationally

  • Single family housing completions up 1.5% from April, down 19.3% as compared to May 2006.
Regionally

  • For the Northeast, single family housing completions up 24.7% from April, down 21.7% as compared to May 2006.
  • For the West, single family housing completions up 1.0% from April, down 27.8% as compared to May 2006.
  • For the Midwest, single family housing completions down 7.2% from April, down 31.9% as compared to May 2006.
  • For the South, single family housing completions up 1.6% from April, down 9.5% as compared to May 2006.
Keep in mind that this particular report does NOT factor in the cancellations that have been widely reported to be occurring in new construction.

Monday, June 18, 2007

Rates and the Rule of Thumb

With lending standards now tightening and interest rates on the rise, it’s possible that home sales, especially in the nation’s most rate sensitive and bubbly areas, could be poised for another leg down.

During the historic run-up, a combination of historically low interest rates and ultra-loose lending standards worked together to allow many more borrowers to qualify for home loans and all borrowers to qualify for larger loans.

With all the interest rates jitters lately, I thought it might be interesting to see how changes to the average 30 year fixed mortgage rate effects the income required for home loans using both the 29% of gross income “Rule of Thumb” and the ultra-loose 50% of gross income rule of the bubble.

The “29% rule” was one of those basic lending standards that went out the window with the boom and simply stated that a borrower (or borrowers) should be limited to a maximum loan “cost” of roughly 29% of their gross income.

Also, the “cost” was not merely the principle and interest payment (P&I) but was to include the property taxes and homeowners insurance (PITI) as well.

Keep in mind, in order to formulate the PITI value for the following charts I simply calculated the monthly P&I for a given loan amount at the prevailing rate and then added a $500 for property taxes and another $100 for homeowners insurance.

First, look at the average 30 year fixed rate as tracked by the Mortgage Bankers Association (click for larger version).

One interesting thing to note is that between 1999 and mid-2000, the rate significantly surpassed 8% and that between 1998 and January 2002 the rate hovered roughly around 7%.

Also note that from January 2002 to mid-2003, the rate declined to a record low of 4.99% and then proceeded to slowly trend up ever since.

Now, in order to get a sense of how affordable typical loans were at past rates and are now, review the following chart that shows the income required to qualify for a $200,000, $400,000 and $600,000 loan using the average 30 year fixed rate and the old standard “29% rule of thumb” (click for larger version).

Notice that during the bubbliest years of 2003 through 2005, a $200,000 loan could be financed conservatively with an annual income of roughly $70,000 (even less at the lowest point) and a $600,000 loan with a little as $160,000 annual income.

Remember, with dual incomes being fairly common these days, two incomes of $80,000 are not that unusual and these couples would have very conservatively been able to afford a $600,000 home loan.

Finally, look how the loose lending standard of 50% of gross income effected loan qualification (click for larger version).

Notice that during the bubbliest years of 2003 through 2005, a $600,000 loan could be financed with an income of just over $90,000.

Again, it’s entirely conceivable that a couple with good credit and a combined income of just over $90,000 (two incomes of $45,000) could be qualified for a $600,000 loan.

Remember, I only used the average 30 fixed rate to build up these charts and if considered, affordability loans such as ARMs with interest only options would make things even more dramatic.

Friday, June 15, 2007

BNN - MUST SEE TV!


This was another busy week for the national housing decline where the latest foreclosure results, a continuation of the subprime meltdown, and a surprise jump in long term interest rates all worked to put significant downward pressure on sentiment.

With the exception of Harvard’s sham State of The Nation’s Housing 2007 Report, many economists seemed to have now written off hopes of any form of recovery in 2007 and are now looking as far as 2009 for some significant bottoming to occur.

First up, Nicholas Retsinas, director of Harvard’s Joint Center for Housing Studies discusses his outlook for housing concluding that the downturn may be prolonged. His perspective is particularly interesting given that the paper his center just produced, being funded in part by the National Association of Realtors and the National Association of Home Builders, takes a much more positive outlook on the future for residential real estate.

Watch Retsinas walk a fine line now on BNN!

Next up, a classic Bull-Bear match pits Brian Wesbury, Chief Economist of First Trust Advisors against Nouriel Roubini, Chairman of RGE Monitor.com on the outlook for housing and the economy and the latest jump in long term interest rates.

Watch Roubini spar now on BNN!

Next, we have a sad CNBC segment that chronicles a poor bastard in Maryland who got caught up in the mania in 2005. He bought a waterfront property in the hopes of subdividing it, creating a luxury “dream” home for himself and another to sell for profit. Unfortunately, he is stuck with a luxury vacation home no one wants and his unfinished dream home and ready for auction.

Watch a poor mans dreams go up in flames now on BNN!

Next, we have a segment that discuses the recent run-up in mortgage rates possibly pushing off any possible housing recovery to 2009. This week, the Mortgage Bankers Association announced that the average rate for a 30 year fixed rate mortgage was 6.61% a value that will surely act to suppress demand especially in the bubbliest and least affordable areas.

Watch rates surge now on BNN!

Finally, a great wrap-up discussing topics from the subprime meltdown on Bear Stearns latest results, the Mortgage Bankers Association record quarterly results for foreclosures and new proposals for the Federal Reserve action against subprime and predatory lending. Includes an interview with PNC Financial Services Group Economist Stuart Hoffman who sees housing as a drag on the economy for the rest of 2007 and into 2008.

Watch the wheels come off the cart now on BNN!