Today’s release of the
S&P/Case-Shiller home price indices for February continues to reflect the extraordinary weakness seen in the nation’s housing markets with now 19 of the 20 metro areas tracked reporting year-over-year declines and ALL metro areas showing substantial declines from their respective peaks.
Furthermore, the decline to the
10 city composite index declined a record 13.55% as compared to February 2007 far surpassing the all prior year-over-year decline records firmly placing the current decline in uncharted territory in terms of relative intensity.
This report indicates that we have now firmly entered the serious price “free-fall” phase (look at the charts below) of the housing bust.
Topping the list of peak decliners was
Las Vegas at -24.53%, Phoenix at -24.05%, San Diego at -23.97%, Detroit at -23.17%, Miami at -22.12%, Los Angeles at -21.58%, Tampa at -20.79%, San Francisco at -20.07%, Washington DC at -17.53%, Minneapolis at -14.72%, Cleveland at -13.50% and Boston at -12.13%
Additionally, both of the broad composite indices showed accelerating declines slumping -15.78% for the 10 city national index and 14.81% for the 20 city national index on a peak comparison basis.
Also, it’s important to note that Boston, having been cited as a possible example of price declines abating, has continued its decline dropping -4.60% on a year-over-year basis and a solid -12.13% from the peak set back in September 2005.
As I had noted in prior posts, Boston has a strong degree of seasonality to its price movements and with both the seasonal drop in sales and the recent stunning new decline to sales as a result of both the looming recession working to erode confidence and the continued lack of affordable Jumbo and Alt-A loans, Boston may continue to decline even through the traditionally string spring selling season.
To better visualize the results use the
PaperEconomy S&P/Case-Shiller/Futures Charting Tool as well as the
PaperEconomy Home Value Calculator and be sure to
read the Tutorial in order to best understand how best to utilize the tool.
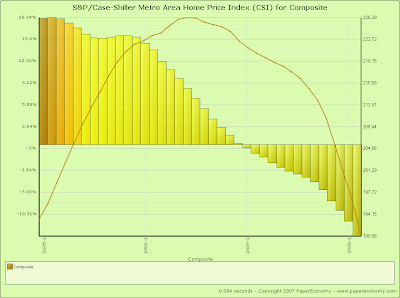
The following chart (click for larger version) shows the percent change to single family home prices given by the Case-Shiller Indices as compared to each metros respective price peak set between 2005 and 2007.

The following chart (click for larger version) shows the percent change to single family home prices given by the Case-Shiller Indices as on a year-over-year basis.

Additionally, in order to add some historical context to the perspective, I updated my “then and now” CSI charts that compare our current circumstances to the data seen during 90s housing decline.
To create the following annual charts I simply aligned the CSI data from the last month of positive year-over-year gains for both the current decline and the 90s housing bust and plotted the data with side-by-side columns (click for larger version).

What’s most interesting about this particular comparison is that it highlights both how young the current housing decline is and clearly shows that the latest bust has surpassed the prior bust in terms of intensity.
Looking at the actual index values normalized and compared from the respective peaks, you can see that we are only eighteen months into a decline that, last cycle, lasted for roughly fifty four months during the last cycle (click the following chart for larger version).

The “peak” chart compares the percentage change, comparing monthly CSI values to the peak value seen just prior to the first declining month all the way through the downturn and the full recovery of home prices.


In this way, this chart captures ALL months of the downturn from the peak to trough to peak again.
As you can see the last downturn lasted 97 months (over 8 years) peak to peak including roughly 43 months of annual price declines during the heart of the downturn.
Notice that peak declines have been FAR more significant to date and, keeping in mind that our current run-up was many times more magnificent than the 80s-90s run-up, it is not inconceivable that current decline will run deeper and last longer.
 Today, the Bureau of Economic Analysis (BEA) released their first preliminary installment of the Q1 2008 GDP report showing a truly anemic annual growth rate of 0.6%.


